


Calgary Market Report
DECEMBER 2023
DECEMBER 2023
If you’re thinking about selling or buying a home, it's important to have a good understanding of what’s going on in the Calgary market.
Knowing the most important data such as the average sales price, number of homes sold, and days on market will better prepare you to sell your home or make an offer.
Our market report showcases everything you need to know about local real estate trends.
New Listings
Inventory
Total Sales
Benchmark Sales Price
Average Days on Market
Months of Supply
Sale-to-List Price
City of Calgary, January 2, 2024 –
Sales in 2023 did ease relative to last year's peak, but with 27,416 sales, levels were still far higher than long-term trends and activity reported before the pandemic. While sales stayed relatively strong, there was a notable shift in activity toward more affordable apartment condominiums style homes.
“Higher lending rates dampened housing demand this year, but thanks to strong migration levels, housing demand remained relatively strong, especially for affordable options in our market,” said CREB® Chief Economist Ann-Marie Lurie. “At the same time, supply levels were low compared to the demand throughout the year, resulting in stronger than expected price growth.”
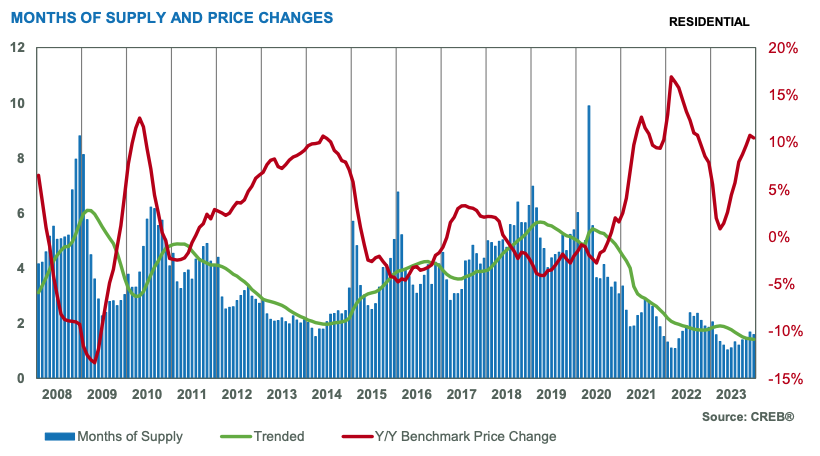
Inventory levels were persistently below long-term trends for the city throughout most of the year, averaging a 44 per cent decline over the 10-year average. We also saw the months of supply remain well below two months throughout most of the year across homes priced below $1,000,000.
The persistently tight conditions contributed to our city's new record high price. While the average annual benchmark price growth did slow from 12 per cent in 2022 to nearly six per cent growth in 2023, the price growth was still relatively strong especially compared to some markets in the country.
Benchmark home prices reflect a typical home to ensure price movements better reflect market activity. Over time, the typical home evolves and the MLS® Home Price Index also evolves to ensure the data remains in line with modern housing trends. As of today, the benchmark price was recalculated based on a modern typical home. Details on the model adjustments can be found on the Canadian Real Estate Association’s website.
HOUSING MARKET FACTS
Detached
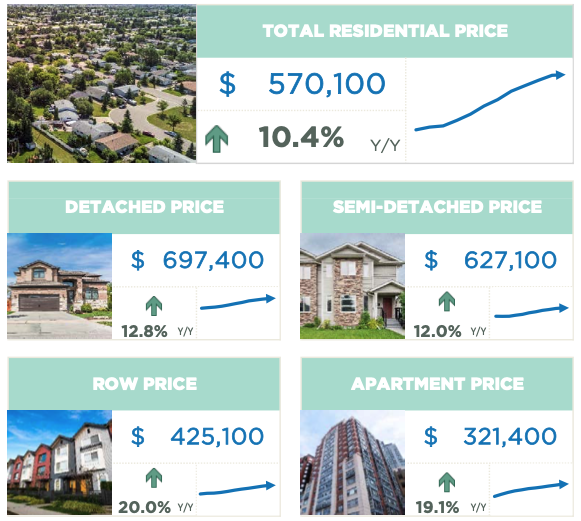
With an annual decline of nearly 20 per cent, the detached market saw the most significant decline in sales activity. While sales did improve for homes priced above $700,000, limited supply choices in the lower price ranges caused consumers to turn to alternative housing styles. Despite some recent gains in higher-priced new listings, inventories have remained near record lows, and the months of supply have remained relatively low throughout 2023.
The persistently tight market conditions have supported further price growth for detached homes, albeit at a slower pace than last year. On average, the benchmark price rose by nearly eight per cent in 2023, with the most significant gains occurring in the city's most affordable districts.
Semi-Detached
Like the detached sector, year-over-year sales growth since May was not enough to offset the pullbacks at the beginning of the year, leaving 2023 sales down by 10 per cent. The decline in sales was driven by pullbacks for homes priced under $500,000, while sales improved for higher-priced properties. The decline in the lower range was primarily due to limited supply choices, preventing stronger sales.
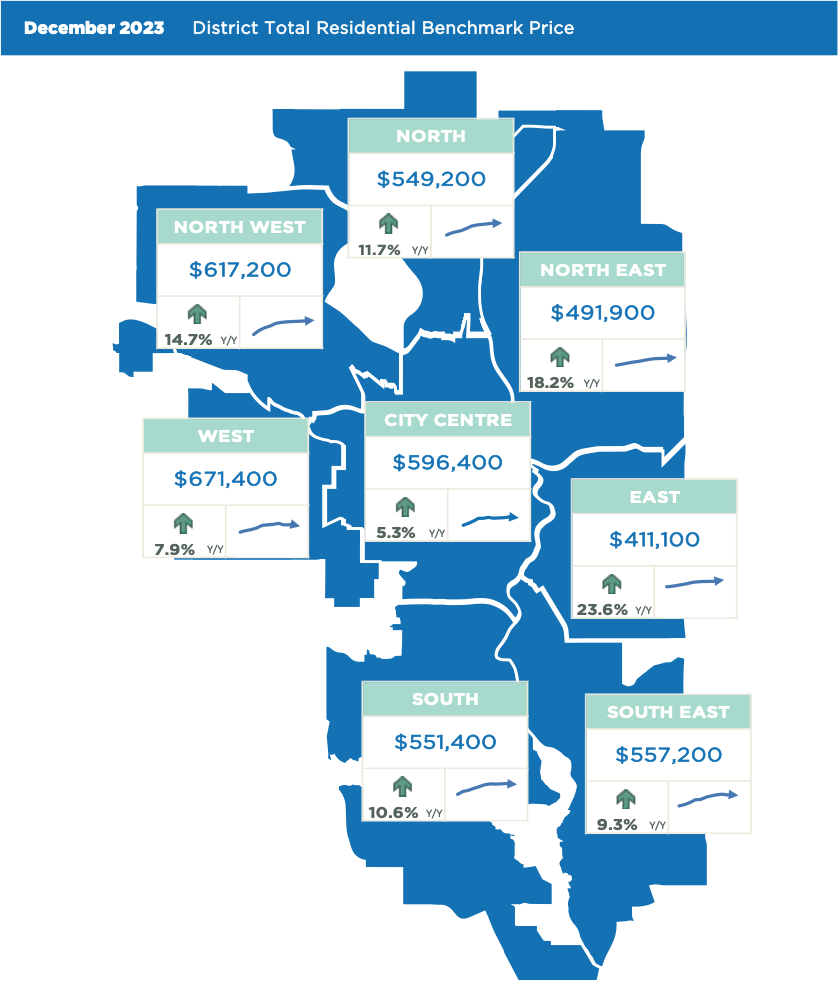
Persistently tight market conditions this year caused prices to trend up throughout most of the year. On an annual basis, the benchmark price rose by seven per cent over last year—a slower gain than the 12 per cent reported in 2022, but still relatively strong. Price growth ranged from a low of six per cent in the city centre to over 16 per cent in the east district.
Row
Limited supply choices in the lower price ranges contributed to the pullback in sales in 2023. Annual sales declined by over 11 per cent despite rising sales for homes priced above $400,000. While new listings did show signs of improving in the second half of the year, all of the gains were reported in the higher price ranges, causing relatively more balanced conditions in the upper price ranges versus the sellers’ market conditions in the lower price ranges.
Conditions favoured the seller throughout the year, supporting an annual benchmark price gain of over 13 per cent. Prices improved across each district, ranging from a low of 11 per cent in the city centre to over 20 per cent price growth in both the North East and East districts.
Apartment Condominium
Apartment-style properties were the only property type to report a gain in sales this year, resulting in a record high of 7,884. The growth in sales was possible thanks to the higher starting point for inventory levels and gains in new listings. However, conditions tightened throughout the year, favouring the seller and driving price growth.
Apartment condominium prices finally recovered from their 2014 high earlier this year and have pushed above those levels, reaching a new record high of $321,400 by December. On an annual basis, the 2023 benchmark price rose by over 13 per cent, a faster pace than the annual growth levels reported last year.
(Source: CREB®)