


Calgary Market Report
MARCH 2026
MARCH 2026
If you’re thinking about selling or buying a home, it's important to have a good understanding of what’s going on in the Calgary market.
Knowing the most important data such as the average sales price, number of homes sold, and days on market will better prepare you to sell your home or make an offer.
Our market report showcases everything you need to know about local real estate trends.
New Listings
Inventory
Total Sales
Benchmark Sales Price
Average Days on Market
Months of Supply
Sale-to-List Price
City of Calgary, April 1, 2026 –
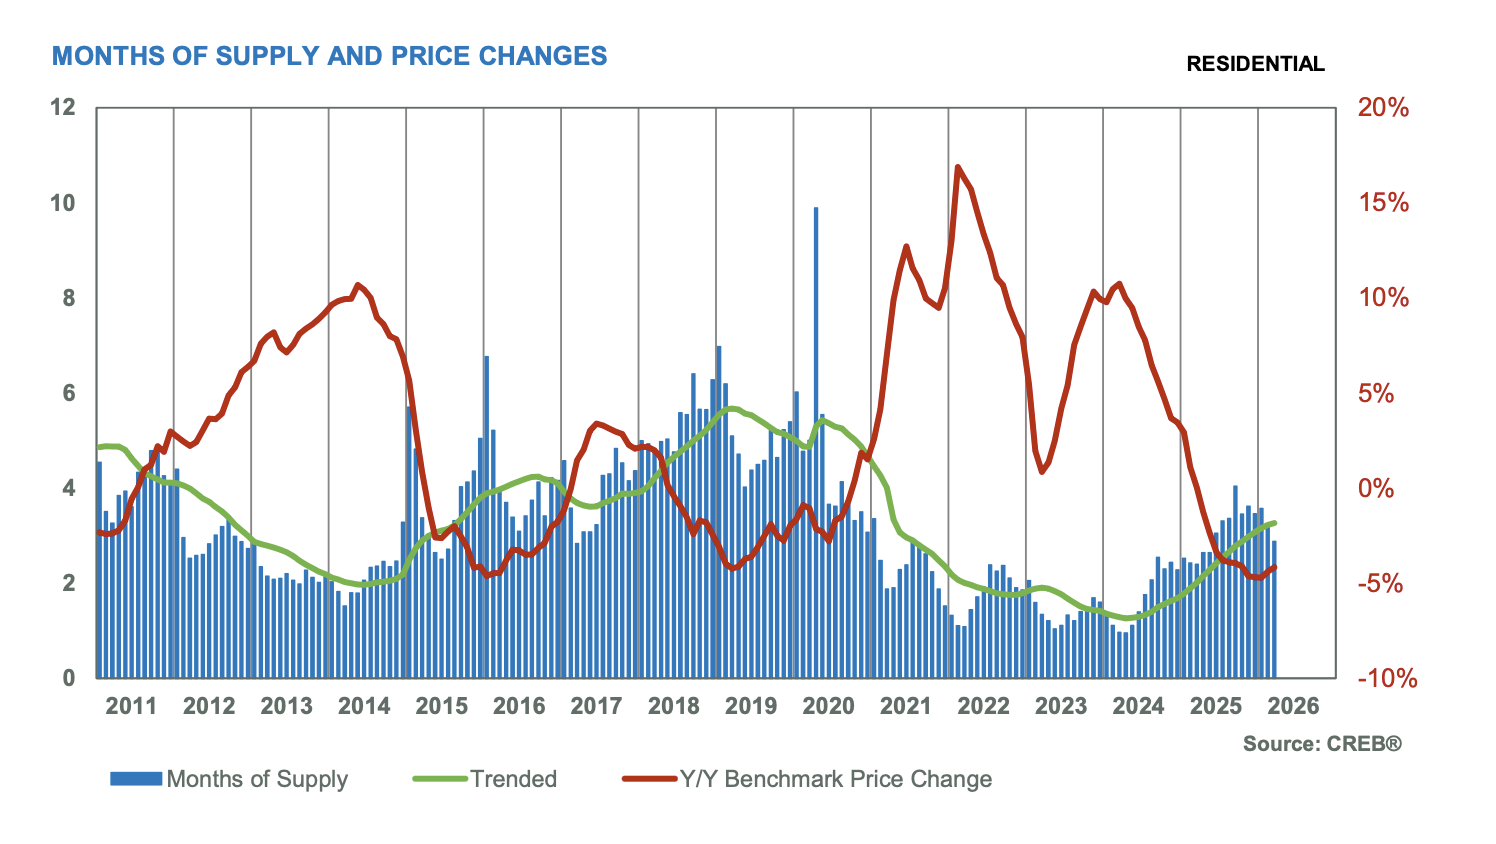
Supply conditions in March varied significantly depending on property type. Inventory levels saw a typical monthly rise, but compared with long-term trends, inventory remained well above the 10-year average for both row and apartment-style units and well below trend for detached homes. This is not a surprise given the pullback in detached housing starts last year despite record-high apartment-style starts.
There were 1,881 sales in March, up from the previous month, but still 13 per cent lower than levels reported last year and below long-term trends for March. The decline in sales is mostly due to pullbacks in apartment-style activity, where increased supply choice and slower migration is spreading demand across a wider range of supply. Meanwhile, detached sales have also slowed compared to long-term trends, likely due to limited supply choice in some city districts.
“When considering total residential housing statistics, conditions appear to be relatively balanced as sales, new listings, inventories and prices all trended up over the previous month as we start to move into the spring market,” said Ann-Marie Lurie, CREB®’s Chief Economist. “However, when we look deeper, we are seeing a market that ranges from tighter conditions for detached homes to the apartment sector, where conditions tend to favour the buyer. As expected, this is supporting upward momentum in detached prices and downward pressure in the apartment condominium sector.”
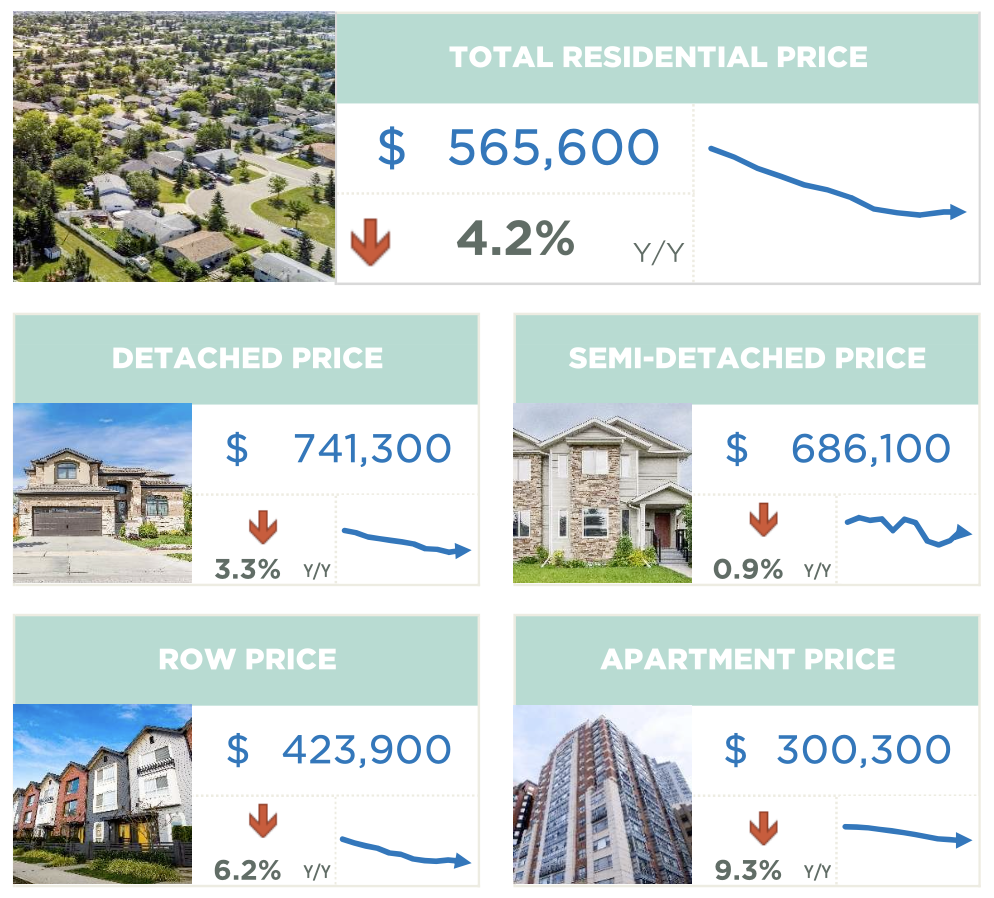
The total unadjusted benchmark price in the city was $565,600, up nearly one per cent compared to February but down by more than four per cent compared to last year. After the first quarter, benchmark prices posted modest to stable conditions for lower density homes. However, apartment condominium prices continued to slide, dropping another three per cent in the first quarter compared to the fourth quarter of last year.
Benchmark home prices reflect a typical home to ensure price movements better reflect market activity. Over time, the typical home evolves and the MLS® Home Price Index also evolves to ensure the data remains in line with modern housing trends. As of today, the benchmark price was recalculated based on a modern typical home. Details on the model adjustments can be found on the Canadian Real Estate Association’s website.
HOUSING MARKET FACTS
Detached
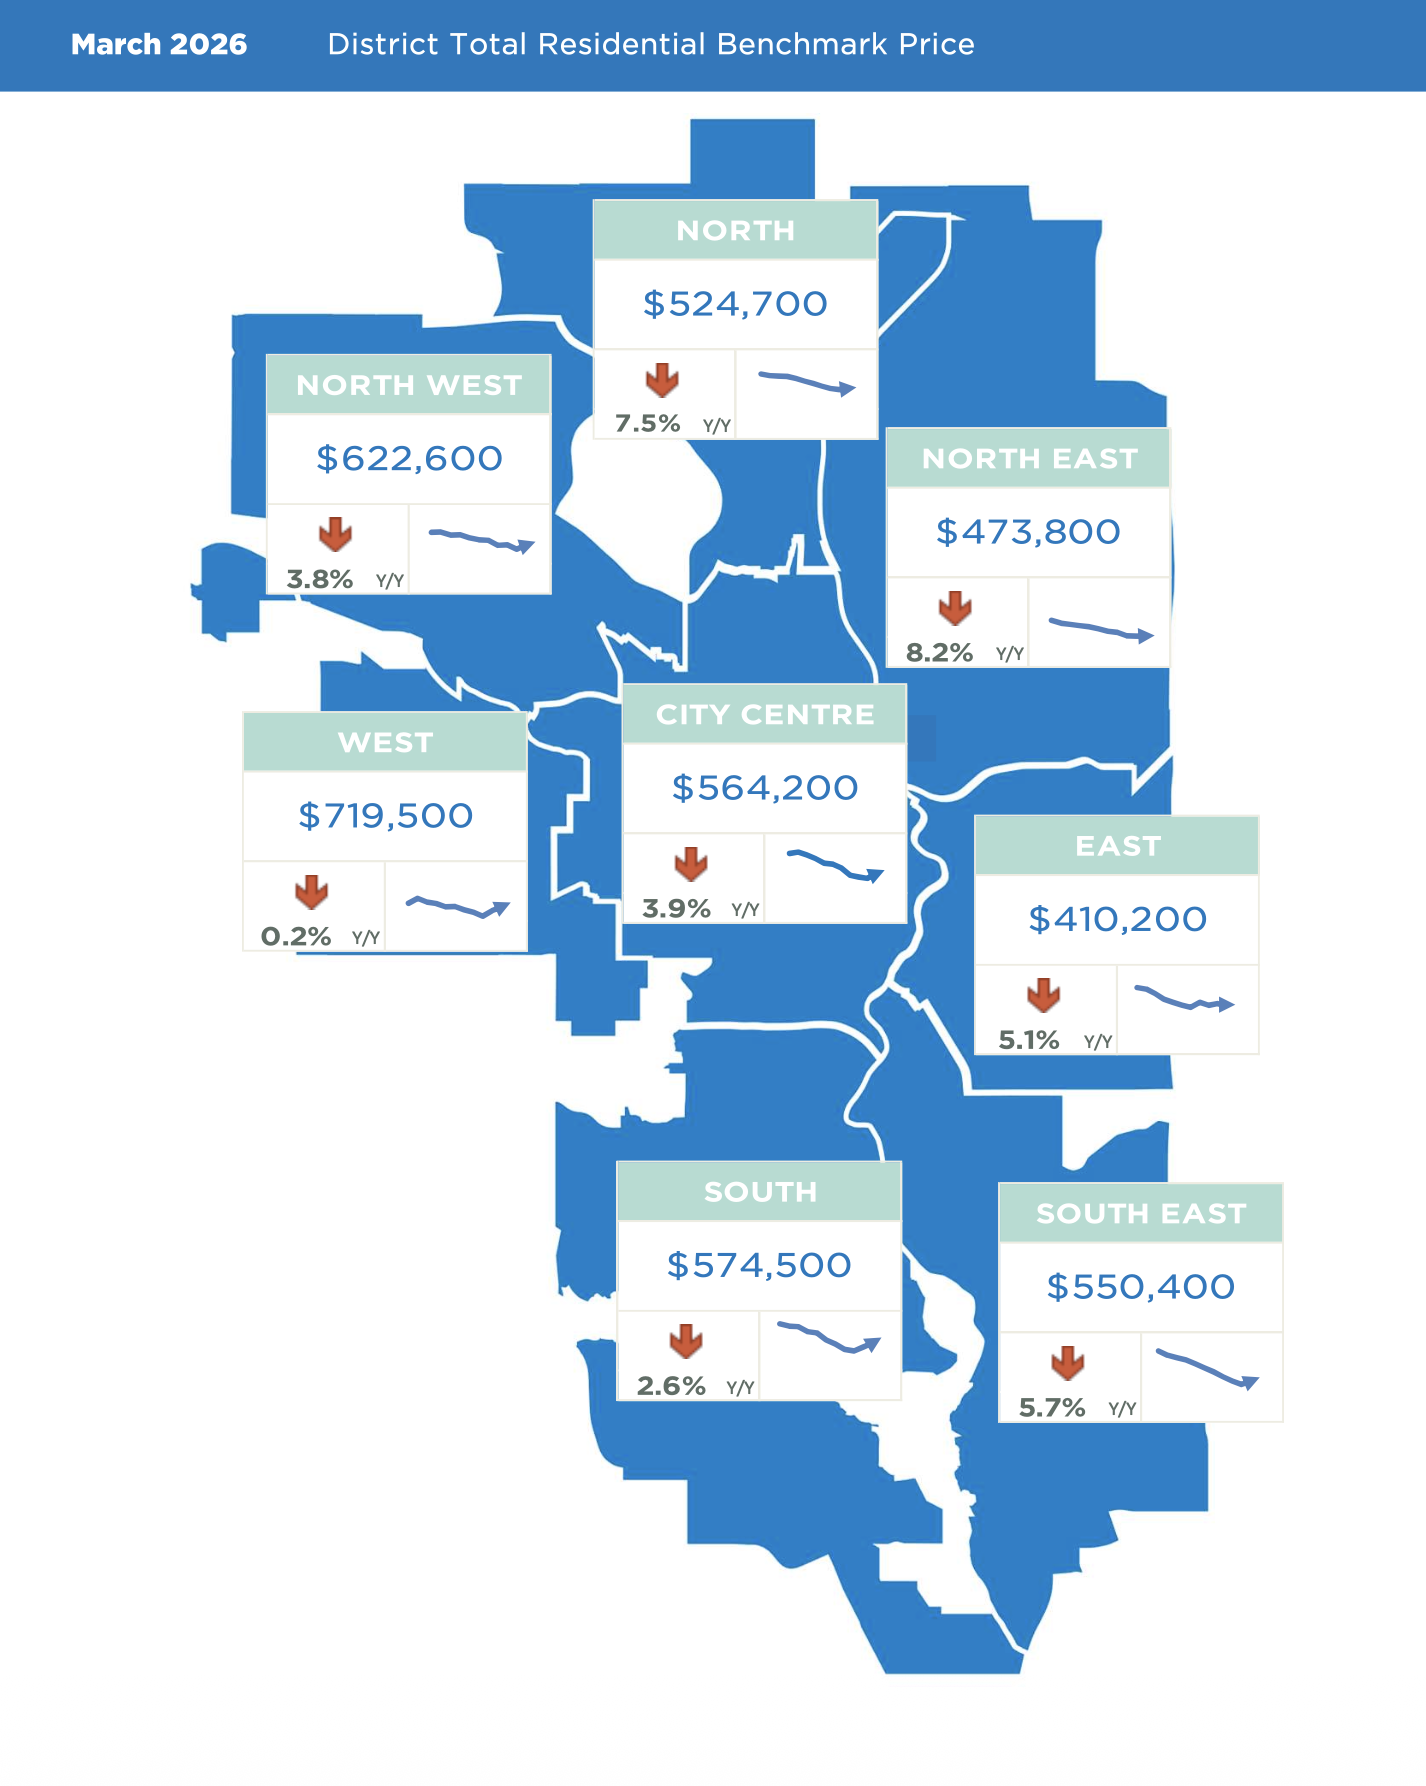
The detached market is exhibiting the tightest conditions compared to all other property types. With 982 sales and 1,614 new listings in March, the sales-to-new-listings ratio rose to 61 per cent, while inventory levels remained similar to those reported last year. With just over two months of supply, conditions in March closely resembled those seen last year at this time. However, conditions varied across the city, with less than two months of supply reported in the North West, West, South, South East and East districts. Meanwhile, conditions were relatively balanced in both the City Centre and North districts, while the North East district continues to struggle with higher supply relative to demand. The detached benchmark price was $741,300 in March, down by three per cent over last year’s peak price of $766,600. However, tight conditions in most parts of the city are driving some price gains. After the first quarter, the largest quarterly gain was reported in the West district, followed by the City Centre and South districts.
Semi-Detached
Sales improved in February, reaching 175 units. At the same time, new listings rose to 253 units, causing the sales-to-new-listings ratio to rise to 69 per cent and preventing any improvement in inventory levels compared to January. This caused the months of supply to drop to 2.4 months, the lowest out of the four property types.
While this is a smaller segment of the market, the tighter conditions did result in slightly higher monthly price gains. As of February, the unadjusted benchmark price was $682,200, over two per cent higher than January and comparable to levels reported last year. Year-over-year price changes varied by district, with gains in the City Centre, North West and West offsetting declines in the North East, North, South, South East and East. In addition to typical seasonal factors, tighter conditions at the start of the year are helping support monthly price gains in most districts.
Row
Row home sales continue to slow compared to last year in March, contributing to a first-quarter decline of 19 per cent. The 778 sales in the first quarter were met with 1,581 new listings, keeping the sales-to-new-listings ratio just below 50 per cent and supporting further inventory gains. In March, there were 960 units in inventory — 25 per cent higher than long-term trends — causing the months of supply to rise to nearly three months. While the row market is relatively balanced in most areas of the city, conditions are favouring the buyer in the North East districts. As of March, the unadjusted benchmark price in the city was $423,900, similar to last month and over six per cent lower than levels reported last year. After the first quarter, benchmark prices remain relatively comparable to levels reported in the previous quarter, as quarterly losses in the North East, North, South East and East districts offset the gains reported in the City Centre and West districts.
Apartment Condominium
Supply levels continue to rise for apartment-style units. With 1,774 units in inventory, levels are just shy of the record high for the month reported during the financial crisis in 2008. New supply growth, along with a sharp pullback in sales relative to new listings, has contributed to the rise in resale inventories. With the sales-to-new-listings ratio hovering around 40 per cent and nearly five months of supply, it is not surprising that prices struggle to improve. As of March, the unadjusted benchmark price was $300,300 — slightly higher than last month but over nine per cent lower than last year’s levels. After the first quarter of this year, apartment prices have eased by nearly three per cent compared with the fourth quarter of last year. While prices eased across all districts, the largest declines occurred in the South and North districts, both exceeding four per cent.
(Source: CREB®)
REGIONAL MARKET FACTS
Airdrie
With 135 sales and 251 new listings, the sales-to-new-listings ratio remained above 50 per cent, supporting modest improvements in inventory and keeping the market relatively balanced at three months of supply. As conditions stay more balanced, prices are showing more signs of stabilizing. In March, the unadjusted benchmark price was $512,800, similar to last month but more than five per cent lower than last year’s levels. Supply choice in the new-home market, along with more options in both Airdrie and north Calgary, has contributed to some of the recent price adjustments in the Airdrie market.
Cochrane
Following a surge in February sales, activity in March eased. After the first three months of the year, sales totalled 235 units, comparable to levels reported last year. At the same time, new listings have been rising at a faster pace, and the sales-to-new-listings ratio has struggled to push above 50 per cent. This has driven inventory gains and caused months of supply to trend up compared with the previous month. Nonetheless, conditions are mostly in-line with longer-term trends, reflecting relatively balanced conditions. This has helped support some of the typical seasonal gain in prices, but not enough to offset earlier pullbacks. Overall, the unadjusted benchmark price in March is $561,200, four per cent lower than levels reported last year.
Okotoks
Improving sales in March were not enough to offset earlier pullbacks, and the first-quarter sales eased slightly compared with last year. Meanwhile, new listings continued to increase, helping shift the market away from extremely tight conditions. However, inventory levels continue to remain relatively low, and the months of supply sit just over two months. As of March, the unadjusted benchmark price was $618,100, trending up compared to levels reported at the end of 2025 and supporting a modest quarterly gain. Despite the improvement, prices remain more than one per cent lower than levels reported at this time last year.
(Source: CREB®)