


Calgary Market Report
MAY 2024
MAY 2024
If you’re thinking about selling or buying a home, it's important to have a good understanding of what’s going on in the Calgary market.
Knowing the most important data such as the average sales price, number of homes sold, and days on market will better prepare you to sell your home or make an offer.
Our market report showcases everything you need to know about local real estate trends.
New Listings
Inventory
Total Sales
Benchmark Sales Price
Average Days on Market
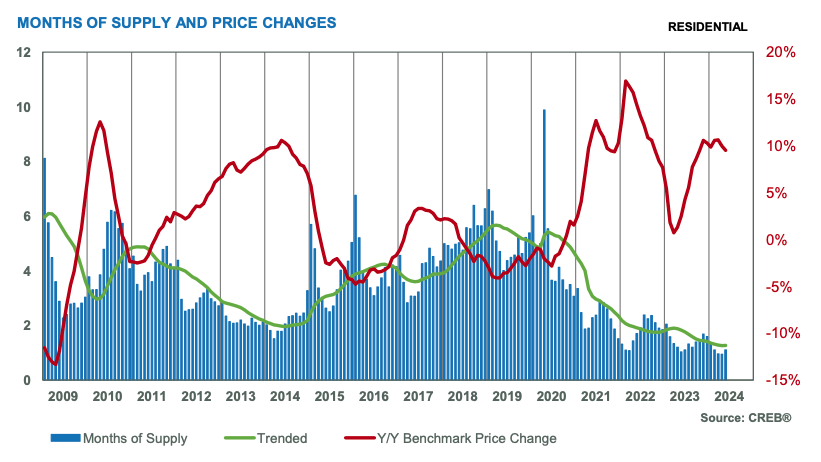
Months of Supply
Sale-to-List Price
City of Calgary, June 3, 2024 –
In a market that continues to show resilience, May saw a total of 3,092 resale home sales. While this figure is nearly one per cent below last year's record high, it is 34 per cent higher than long-term trends for the month. The pullback in sales was primarily driven by declines in lower-priced detached and semi-detached homes, where there was limited supply choice compared to last year.
"Although new listings have increased, much of this growth is in higher price ranges for each property type," said Ann-Marie Lurie, Chief Economist at CREB®. “Our strong economic situation has supported sales growth in these higher price ranges. However, this month's sales could not offset the declines in the lower price ranges due to a lack of supply choice."
New listings in May reached 4,333 units, almost 19 per cent higher than last year. This increase in new listings compared to sales caused the sales-to-new listings ratio to drop to 71 per cent, supporting a modest year-over-year inventory gain. Despite this, inventory levels remained nearly half what we typically see in May, with most gains driven by homes priced above $700,000.
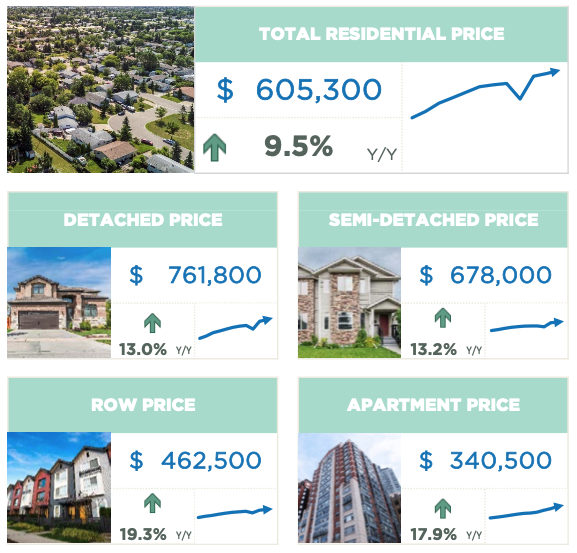
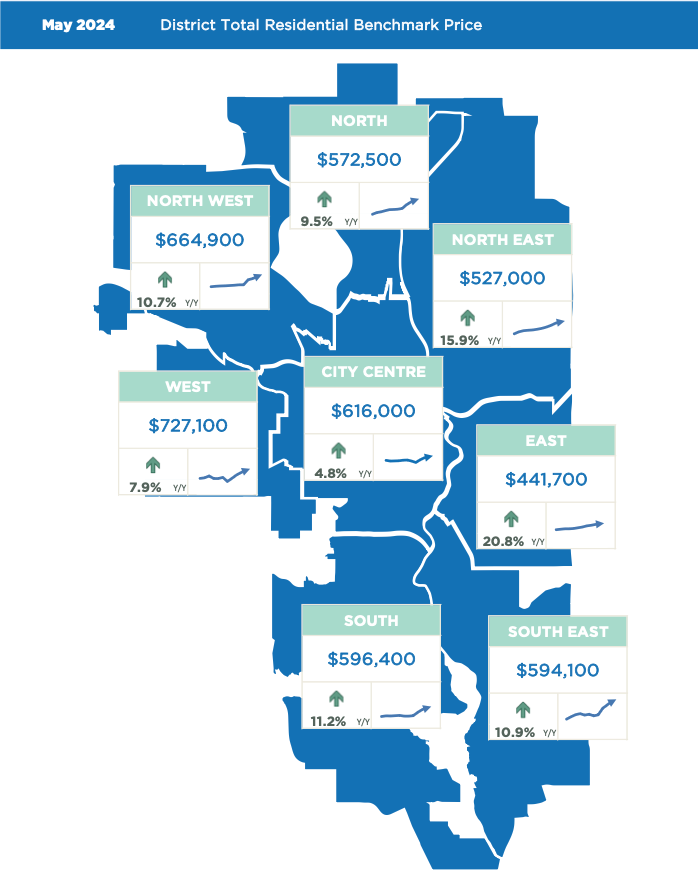
While inventories did improve this month, conditions continue to favour sellers with one month of supply. Several districts continue to report less than one month of supply, while the City Centre reported the highest supply-to-sales ratio at one and a half months. Seller market conditions drove price growth across all districts in the city. The unadjusted total residential benchmark price in May reached $605,300, nearly one per cent higher than last month and 10 per cent higher than last May.
Benchmark home prices reflect a typical home to ensure price movements better reflect market activity. Over time, the typical home evolves and the MLS® Home Price Index also evolves to ensure the data remains in line with modern housing trends. As of today, the benchmark price was recalculated based on a modern typical home. Details on the model adjustments can be found on the Canadian Real Estate Association’s website.
HOUSING MARKET FACTS
Detached
The gain in detached sales for homes priced over $700,000 was not enough to offset pullbacks across the lower price ranges, as year-over-year sales declined by seven per cent. At the same time, new listings rose enough to cause the sales-to-new-listings ratio to drop to 68 per cent, supporting inventory growth. However, inventory levels for homes priced below $600,000 continued to fall, accounting for only 13 per cent of the detached market.
With just over one month of supply, the detached market continues to favour the seller, and prices continue to rise. As of May, the unadjusted benchmark price reached $761,800, over one per cent higher than last month and 13 per cent higher than prices reported last year. Prices improved across all districts, with the most significant year-over-year gains occurring in the most affordable districts.
Semi-Detached
The year-over-year decline in sales did not offset earlier gains, as year-to-date sales rose by nearly 11 per cent. Like the detached sector, we have also seen improved levels of new listings come onto the market, causing the sales-to-new listings ratio to drop to 72 per cent and driving some gains in inventory levels.
Nonetheless, the market continues to favour the seller with one month of supply. The persistently tight market conditions continue to drive up prices. The benchmark price reached $678,000 in May, over one per cent higher than last month and 13 per cent higher than last May.
Row
May reported 540 sales, a gain over last year that has contributed to the 16 per cent year-to-date rise. At the same time, new listings also rose, supporting a gain in inventory levels. Inventory levels have declined for properties below $400,000, but the gains reported for higher-priced row properties were enough to support overall inventory gains.
With a sales-to-new-listings ratio of 78 per cent and a months of supply below one month, conditions continue to favour the seller, driving further price growth. In May, the benchmark price reached $462,500, nearly two per cent higher than last month and over 19 per cent higher than last year’s levels.
Apartment Condominium
Demand for affordable homes continues to drive growth for apartment condominium-style homes. May sales continued to rise, contributing to the year-to-date record high with a 19 per cent gain. This was partly possible thanks to gains in new listings preventing a further drop in inventory levels. While inventory levels are similar to last year, the gains for products over $300,000 offset the steep declines for lower-priced homes.
With a months of supply of just over one month, conditions still favour the seller, and prices continued to increase compared to last month's and last year’s levels. Year-over-year price gains exceeded 30 per cent in the North East and East districts, with the lowest price growth occurring in the City Centre at 13 per cent.
(Source: CREB®)