


Calgary Market Report
APRIL 2023
APRIL 2023
If you’re thinking about selling or buying a home, it's important to have a good understanding of what’s going on in the Calgary market.
Knowing the most important data such as the average sales price, number of homes sold, and days on market will better prepare you to sell your home or make an offer.
Our market report showcases everything you need to know about local real estate trends.
New Listings
Inventory
Total Sales
Benchmark Sales Price
Average Days on Market
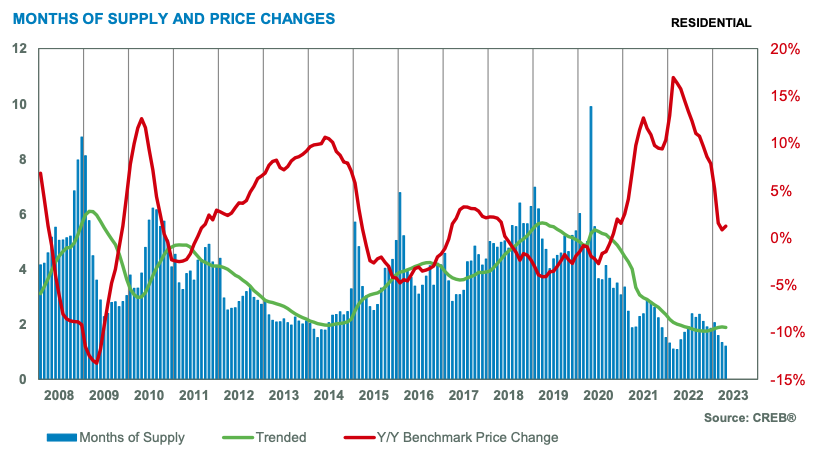
Months of Supply
Sale-to-List Price
City of Calgary, May 1, 2023 –
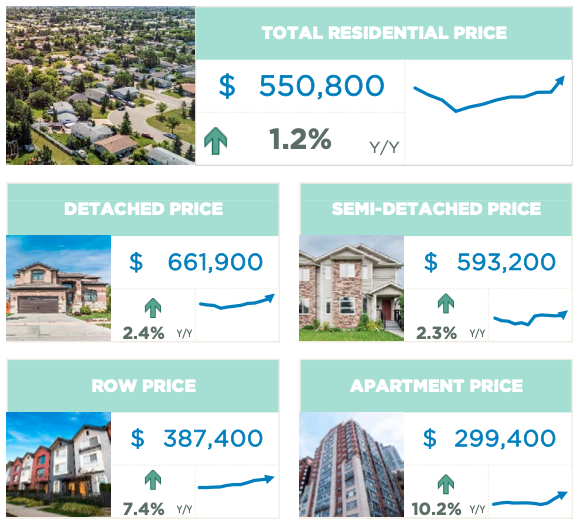
Persistent sellers’ market conditions placed further upward pressure on home prices in April. After four months of persistent gains, the total unadjusted benchmark price reached $550,800, nearly two per cent higher than last month and a new monthly record high for the city.
“While sales activity is performing as expected, the steeper pullback in new listings has ensured that supply levels remain low,” said CREB® Chief Economist Ann-Marie Lurie. “The limited supply choice is causing more buyers to place offers above the list price, contributing to the stronger than expected gains in home prices.”
In April, sales reached 2,690 units compared to the 3,133 new listings. With a sales-to-new-listings ratio of 86 per cent, inventories declined by 34 per cent compared to last year and are over 45 per cent below long-term averages for April.
While sales have eased by 21 per cent compared to last year, the steep decline in supply has caused the months of supply to ease to just over one month. This reflects tighter market conditions than earlier in the year and compared to conditions reported last April.
Benchmark home prices reflect a typical home to ensure price movements better reflect market activity. Over time, the typical home evolves and the MLS® Home Price Index also evolves to ensure the data remains in line with modern housing trends. As of today, the benchmark price was recalculated based on a modern typical home. Details on the model adjustments can be found on the Canadian Real Estate Association’s website.
HOUSING MARKET FACTS
Detached
New listings have eased across all price ranges in the detached market, with the most significant declines occurring for homes priced below $700,000. The decline in new listings far outpaced the pullback in sales, causing the sale-to-new listings ratio to rise to 88 per cent and the months of supply to fall to just over one month, tighter than both last year and last month.
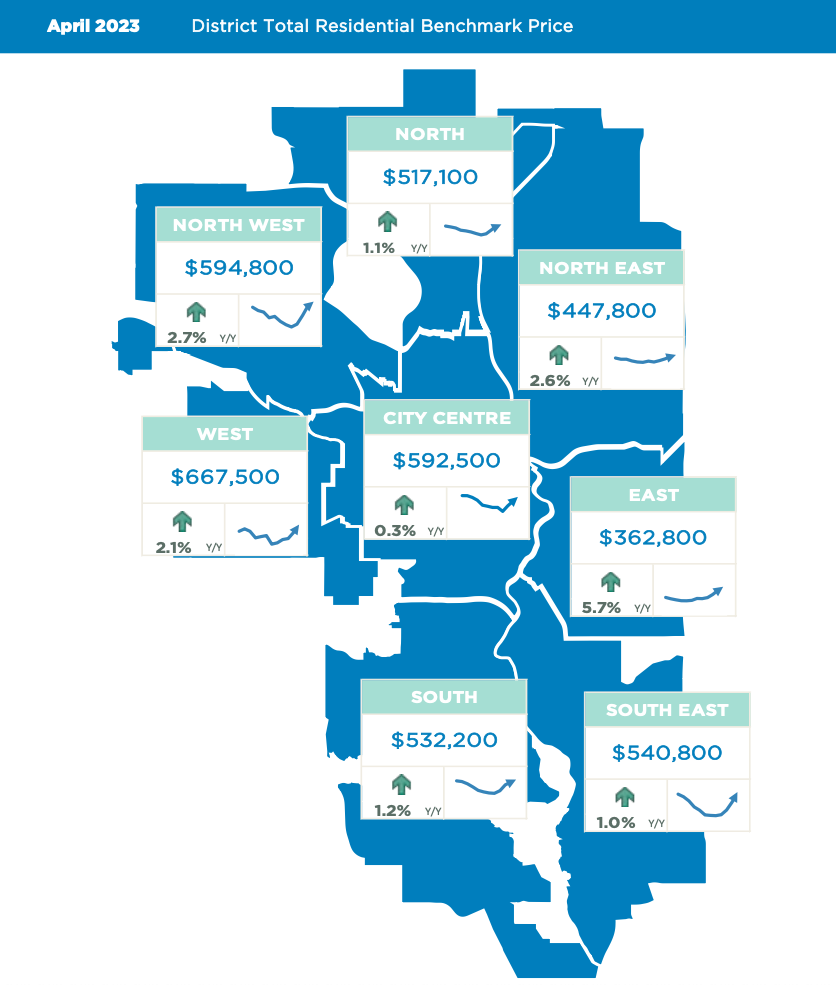
The persistently tight market conditions have contributed to further price growth. In April, the detached benchmark price reached a new record high at $661,900. Every district except the City Centre reported a new record high price in April. The City Centre is also the only district that reported over two months of supply. With a year-over-year gain of 6 per cent, the most affordable East district reported the largest price gain.
Semi-Detached
With 234 sales and 264 new listings in April, the sales to new listings ratio jumped to 89 per cent. This caused further declines in inventory levels, which are at the lowest April level seen since 2007. As conditions are tighter than last year, it is not a surprise to see further price growth.
The unadjusted benchmark price in April reached and new record high at $593,200, reflecting a two per cent gain over last month’s and last year’s prices. While all districts posted a new record high price this month, the strongest gains occurred in the most affordable North East and East districts.
Row
Row properties faced the tightest market conditions in April, with a sales-to-new-listings ratio of 95 per cent and months of supply under one month. Row sales have eased over last April’s record high, but with 416 sales, activity is still far stronger than long-term trends. Relative affordability has supported the strong demand in this sector. However, the persistently tight market conditions have placed significant pressure on home prices.
After four consecutive monthly gains, the benchmark price reached a new record high of $387,400, over seven per cent higher than last year. Like other areas, the steepest price growth occurred in the most affordable districts of the North East, East and South.
Apartment Condominium
Thanks to a boost in new listings in April, the apartment condominium sector was the only sector to see sales activity rise over last year’s levels. With 953 new listings and 734 sales, inventories did trend up over the previous month but remained below the levels reported last year at this time. With a sales-to-new-listings ratio of 77 per cent and a months of supply of 1.5, conditions are not as tight as other property types in the city. However, this still reflects sellers’ market conditions and has been driving up prices.
As of April, the unadjusted benchmark price reached $299,400, a significant gain over the $277,600 reported at the start of the year and over 10 per cent higher than last April. Following four months of consecutive gains, prices are now just shy of the previous high reported in 2014. While price gains across all districts have not resulted in a new city-wide record, the North, North West and South East reported new highs in April.
(Source: CREB®)