


Calgary Market Report
MARCH 2023
MARCH 2023
If you’re thinking about selling or buying a home, it's important to have a good understanding of what’s going on in the Calgary market.
Knowing the most important data such as the average sales price, number of homes sold, and days on market will better prepare you to sell your home or make an offer.
Our market report showcases everything you need to know about local real estate trends.
New Listings
Inventory
Total Sales
Benchmark Sales Price
Average Days on Market
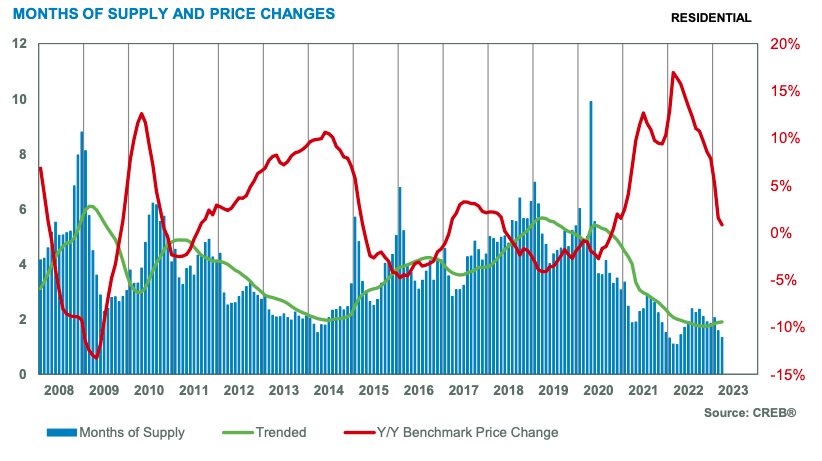
Months of Supply
Sale-to-List Price
City of Calgary, April 3, 2023 –
Sales and new listings have improved over the levels reported at the beginning of the year. As a result, the spread between sales and new listings supported some expected monthly inventory level gains. However, the 3,233 available units reflected the lowest March inventory levels since 2006 and left the months of supply just above one month, firmly in the seller’s territory. While conditions are not as tight as last March, low inventory levels leave purchasers with limited choice, once again driving up home prices.
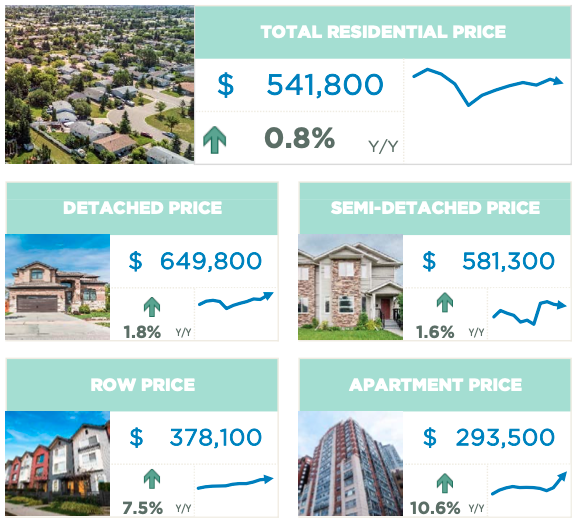
Total unadjusted residential home prices reached $541,800 in March, a two per cent gain over last month and nearly one per cent higher than prices reported last year. While prices remain below the May 2022 high of $546,000, the pace of price growth over the first quarter has been stronger than expected due to the persistent seller’s market conditions.
“As expected, sales have eased from record levels while remaining stronger than they were before the pandemic thanks to recent gains in migration supporting demand,” said CREB® Chief Economist Ann-Marie Lurie.
“The challenge has been centered around supply. As a result, existing homeowners may be reluctant to list as they struggle to find an acceptable housing alternative in this market. At the same time, higher lending rates can also reduce the incentives for existing homeowners to list their home.”
March recorded 3,318 new listings compared to the 2,432 sales, leaving the sales-to-new listings ratio relatively high at 73 per cent. However, both sales and new listings have eased by 40 per cent compared to levels reported last March.
Benchmark home prices reflect a typical home to ensure price movements better reflect market activity. Over time, the typical home evolves and the MLS® Home Price Index also evolves to ensure the data remains in line with modern housing trends. As of today, the benchmark price was recalculated based on a modern typical home. Details on the model adjustments can be found on the Canadian Real Estate Association’s website.
HOUSING MARKET FACTS
Detached
Lower listings and higher lending rates have contributed to the steep pullback in detached sales. With 1,145 sales, this is the only property type where activity has fallen below long-term trends for the month. However, despite the drop in sales, inventory levels remain comparable to the lowest March levels recorded in 2006.
The persistently tight market conditions have contributed to further price growth. In March, the detached benchmark price reached a new record high at $649,800. Conditions are much tighter at the lower end of the market as supply levels have shifted. Nearly 63 per cent of the new listings that have come onto the market so far this year are priced over $600,000, much higher than the 48 per cent reported last year.
Semi-Detached
Like other property types, sales and new listings reported a significant drop over last year’s levels, leaving the market exceptionally tight with a sales-to-new listings ratio of 78 per cent in March. In addition, higher lending rates have driven many purchasers to seek semi-detached properties. However, conditions remained exceptionally tight for properties priced below $600,000.
Low inventory levels relative to the sales in the market drove further price gains this month. As a result, the unadjusted benchmark price reached $581,300 in March, over two per cent higher than last month and nearly two per cent higher than last year’s levels. However, despite the strong gains over the past several months, prices remain shy of the May 2022 monthly high of $584,700.
Row
While row sales, new listings and inventory levels have all trended up compared to levels seen at the start of the year, like other property types, levels are much lower than last year. With one month of supply available, conditions continue to favour the seller. The tight market conditions also placed further upward pressure on prices.
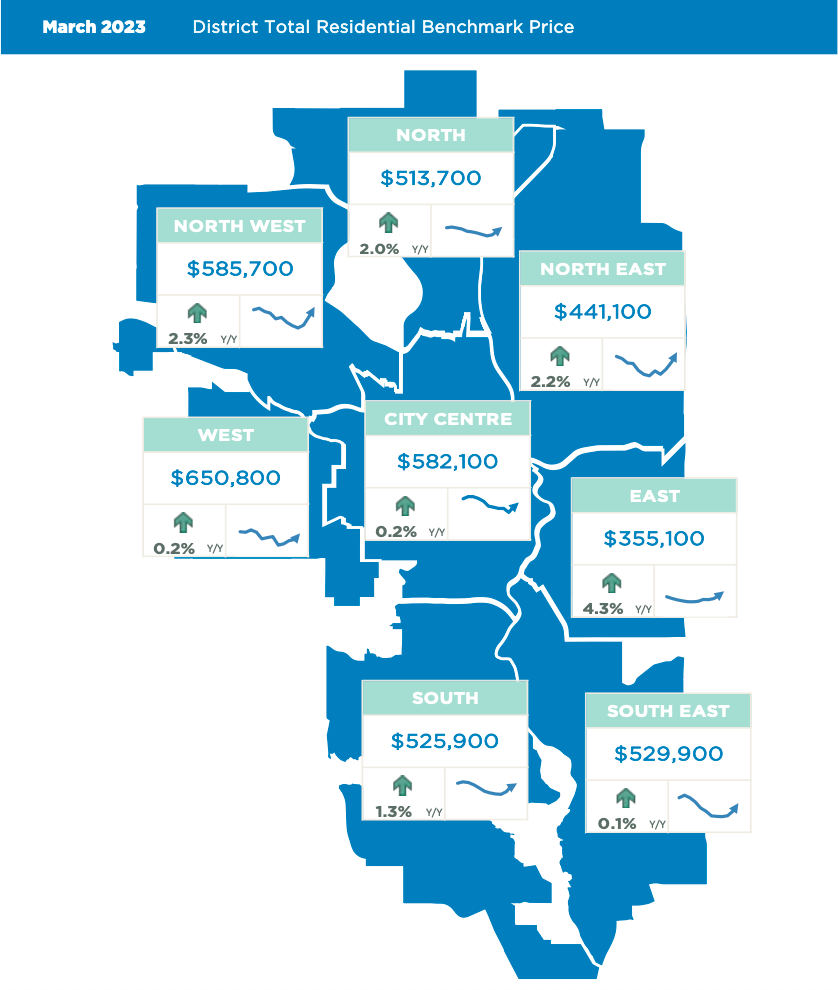
In March, the benchmark price rose to $378,100, reflecting a year-over-year gain of nearly eight per cent and representing a new monthly record high. Price growth was strongest in the city’s North East and South districts, with the lowest year-over-year gains occurring in the West district.
Apartment Condominium
March reported 682 apartment condominium sales, a decline of 11 per cent over last year’s record high. New listings also eased by eight per cent compared to last year, keeping inventory levels relatively low at 1,000 units. The low inventory levels compared to sales kept the months of supply well below two months, ensuring the market continued to favour the seller.
The benchmark price in Calgary reached $293,500, a year-over-year gain of nearly 11 per cent. The recent increase in price is shifting this market closer to full price recovery. For example, apartment condominium prices reached a monthly high back in November 2014 at $306,600.
(Source: CREB®)