


Calgary Market Report
MAY 2022
MAY 2022
If you’re thinking about selling or buying a home, it's important to have a good understanding of what’s going on in the Calgary market.
Knowing the most important data such as the average sales price, number of homes sold, and days on market will better prepare you to sell your home or make an offer.
Our market report showcases everything you need to know about local real estate trends.
New Listings
Inventory
Total Sales
Average Sales Price
Average Days on Market
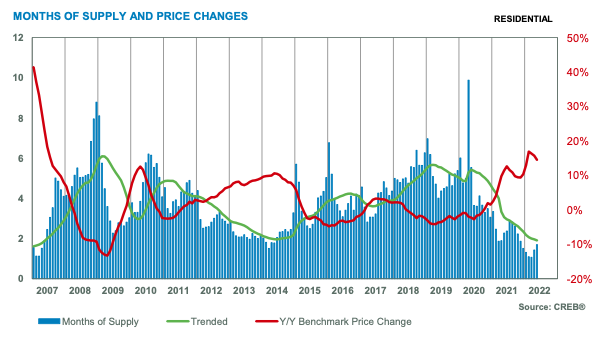
Months of Supply
Sale-to-List Price
City of Calgary, June 1, 2022 –
For the second month in a row, sales activity trended down after all-time record high sales in March. While activity in the market slowed down in May with 3,071 sales, levels are still slightly higher than last year’s record high and are far stronger than typical levels of activity recorded in May.
“It’s not a surprise to see sales ease from the exceptionally strong levels seen earlier in the year. Many buyers were eager to get into the market ahead of the rate gains that we are now seeing,” said CREB® Chief Economist Ann-Marie Lurie.
“While higher lending rates are weighing on sales activity, the market is still struggling with supply levels and rising prices which could also be contributing to slower sales, especially in the detached market. Nonetheless, if this shift continues, we could begin to see more balanced conditions in the market over the next several months, slowing the pace of price growth in the market.”
Slower sales were met with a decline in new listings, but a strong pullback in sales was enough to cause inventories to trend up relative to levels seen over the past few months. While inventory remains well below historical norms, the monthly gains did take off some of the pressure in the market. However, with just under two months of supply, the market continues to favour the seller.
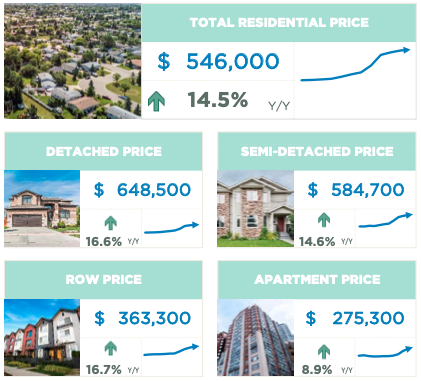
Tight market conditions continue to contribute to further price gains in the market, but the pace of growth has eased relative to what occurred over the previous four months. Overall, the benchmark price reached $546,000 in May, over 14 per cent higher than last year’s levels.
Benchmark home prices reflect a typical home to ensure price movements better reflect market activity. Over time, the typical home evolves and the MLS® Home Price Index also evolves to ensure the data remains in line with modern housing trends. As of today, the benchmark price was recalculated based on a modern typical home. Details on the model adjustments can be found on the Canadian Real Estate Association’s website.
HOUSING MARKET FACTS
Detached
Higher lending rates, steep price gains and exceptionally tight conditions in the market are starting to weigh on consumers and contributing to the pullback in detached sales this month. Sales trended down in all locations except the most affordable North East and East markets in the city, which continue to record sales growth. Slower sales were met with a pullback in new listings which prevented any steep gains in inventory levels. With 2,552 units in inventory and 1,620 sales, the months of supply edged up over last month but continues to favour the seller.
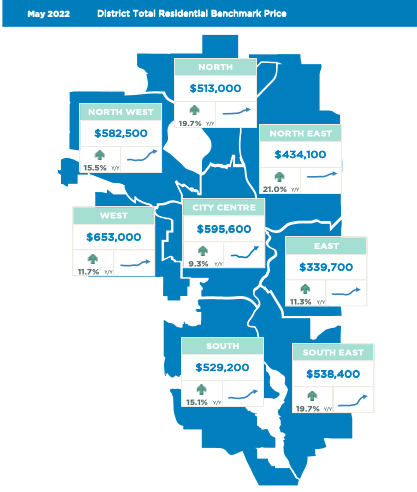
Persistently tight conditions did contribute to further price gains this month, but the pace of growth has eased compared to earlier in the year. Detached benchmark prices reached $648,500 in May, nearly 17 per cent higher than last year. Year-over-year gains have occurred across all districts with the gains ranging from a low of 10 per cent in the City Centre to over 22 per cent in the South East and North East.
Semi-Detached
Like the detached sector, sales slowed this month for semi-detached properties. However, sales still remain relatively strong and on a year-to-date basis are still higher than levels recorded last year. New listings also slowed, but at a slower pace than sales causing some modest monthly gains in inventory levels and some monthly gains in the months of supply. However, with less than two months of supply, this segment continues to favour the seller.
While prices continued to rise for semi-detached properties, the pace of growth has eased from earlier in the year. In May, the semi-detached benchmark price reached $584,700, nearly 15 per cent higher than the same time last year. Price gains have occurred across all districts with the strongest year-over-year gain occurring in the North district of the city.
Row
Like other property types, sales activity trended down from the March high. However, sales in May were still higher than last year’s levels and reflect a new record high for May. Row properties in the city are generally more affordable than both detached and semi-detached properties. Higher prices in other sectors and rate gains are likely driving more consumers toward row style properties.
While some monthly gains in inventories did help push up the months of supply, with 1.5 months of supply conditions continue to favour the seller. The persistently tight conditions placed further upward pressure on prices, however, the pace of growth is easing. As of May, the benchmark price reached $363,300, nearly 17 per cent higher than last year’s levels.
Apartment Condominium
Recent gains in sales and prices likely encouraged the boost in new listings this month for apartment condominiums. While sales did improve significantly compared to last year, the sales-to-new-listings ratio eased to 67 per cent and inventories edged up over relative to levels seen over the past five months. This rise was enough to push up the months of supply to over two months. While this segment of the market has been more sensitive to supply shifts, conditions still remain relatively tight supporting further price gains.
The benchmark price in May reached $275,300, over one per cent higher than last month and nearly nine per cent higher than last year. Prices trended up in every district helping support price recovery. Despite the growth, prices are still over 10 per cent below the highs set back in 2014.
(Source: CREB®)