


Calgary Market Report
SEPTEMBER 2022
SEPTEMBER 2022
If you’re thinking about selling or buying a home, it's important to have a good understanding of what’s going on in the Calgary market.
Knowing the most important data such as the average sales price, number of homes sold, and days on market will better prepare you to sell your home or make an offer.
Our market report showcases everything you need to know about local real estate trends.
New Listings
Inventory
Total Sales
Average Sales Price
Average Days on Market
Months of Supply
Sale-to-List Price
City of Calgary, October 3, 2022 –
Strong sales for condominium apartment and row properties was not enough to offset declines reported for other property types. This caused city sales to ease by nearly 12 per cent compared to last year.
However, with 1,901 sales in September, activity is still far stronger than levels achieved prior to the pandemic and is well above long-term trends for September. Despite recent pullbacks in sales, and thanks to strong levels earlier in the year, year-to-date sales remain 15 per cent higher than last year’s levels.
“While demand is easing, especially for higher priced detached and semi-detached product, purchasers are still active in the affordable segments of the market, cushioning much of the impact on sales,” said CREB® Chief Economist Ann-Marie Lurie. “At the same time, we are seeing new listings ease, preventing the market from becoming oversupplied and supporting more balanced conditions.”
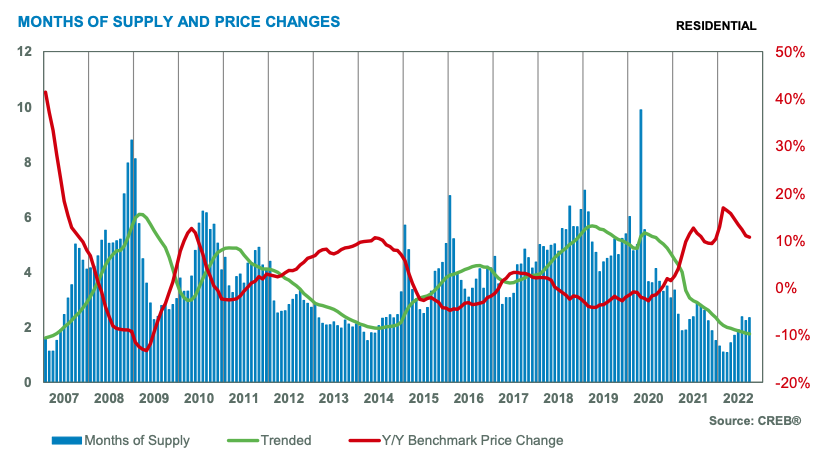
In September, new listings declined by ten per cent. With a sales-to-new-listings ratio of 72 per cent, it was enough to prevent any gain in inventory levels, which declined over last month and were nearly 21 per cent lower than last year’s levels. The adjustments in both sales and supply levels have caused the months of supply to remain relatively low at less than three months.
The shift to more balanced conditions is causing some adjustments to home prices. While prices have slid from the highs seen in May, as of September, benchmark prices remain 11 per cent higher than last year and six per cent higher than levels reported at the beginning of the year.
Benchmark home prices reflect a typical home to ensure price movements better reflect market activity. Over time, the typical home evolves and the MLS® Home Price Index also evolves to ensure the data remains in line with modern housing trends. As of today, the benchmark price was recalculated based on a modern typical home. Details on the model adjustments can be found on the Canadian Real Estate Association’s website.
HOUSING MARKET FACTS
Detached
For the sixth consecutive month, sales activity has slowed in the detached market and is now offsetting the gains recorded in the first quarter. The recent decline in sales has been mostly driven by a reduction in the under $500,000 segment of the market, as a significant reduction in supply for those price ranges have left little options for potential purchasers.
At the same time, detached sales continue to improve for homes priced between $600,000 - $999,9999. This higher price range group has reported the largest growth in new listings and overall supply levels.
While the overall detached market is far more balanced than it was earlier this year, for homes priced below $500,000 conditions remain relatively tight. This is likely causing divergent trends in pricing activity based on price range.
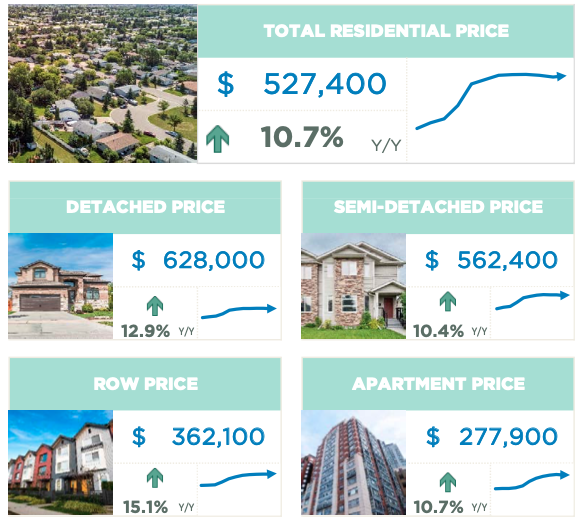
Overall, detached prices eased by nearly one per cent over the last month with the largest monthly decline occurring in the City Centre district. Despite monthly adjustments, prices remain nearly 13 per cent higher than last year.
Semi-Detached
Further pullback in sales this month was not enough to offset gains from earlier in the year as year-to-date sales remained six per cent higher than last year’s levels. While new listings in this segment can vary month-to-month, year-to-date new listings have remained just slightly lower than levels achieved last year. This kept inventories at levels that are still far below long-term trends.
The recent pullback in sales was enough to cause the months of supply to push up relative to levels seen earlier in the year. However, with less than three months of supply, conditions remain relatively tight for this property type.
While conditions do remain tight, prices still trended down following higher than expected gains earlier this year. Overall, benchmark prices remain over 10 per cent higher than levels reported last year.
Row
Row sales activity improved over last year’s levels, contributing to the year-to-date record high pace of sales. Recent pullbacks in new listings and strong sales activity have caused inventory levels to remain low, keeping the months of supply below two months.
With conditions remaining tight, prices stay mostly unchanged compared to last month and are 15 per cent higher than prices reported in September 2021. The highest year-over-year price gains occurred in the North district.
Apartment Condominium
With a new September record, apartment condominium sales continue to rise relative to last year, contributing to year-to-date sales of 5,026, a 60 per cent gain over last year. While new listings also improved so far this year, it has not been enough to prevent some easing in inventory levels.
Unlike the other sectors, since 2016, inventories have generally been higher for apartment condominium. It is only the strong demand this year that has caused this market to shift from buyers’ market conditions reported throughout most of last year to one that is now relatively balanced.
Relatively balanced conditions prevented any significant shift in prices this month compared to last month and overall, apartment condominium prices remain over 10 per cent higher than last year’s levels. Despite recent gains, prices remain below the 2014 high.
(Source: CREB®)