


Calgary Market Report
JULY 2023
JULY 2023
If you’re thinking about selling or buying a home, it's important to have a good understanding of what’s going on in the Calgary market.
Knowing the most important data such as the average sales price, number of homes sold, and days on market will better prepare you to sell your home or make an offer.
Our market report showcases everything you need to know about local real estate trends.
New Listings
Inventory
Total Sales
Benchmark Sales Price
Average Days on Market
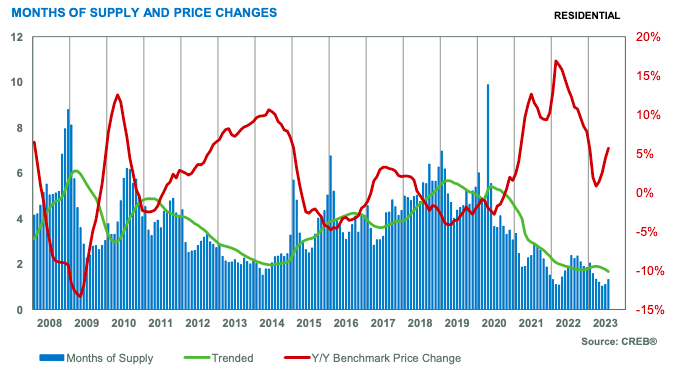
Months of Supply
Sale-to-List Price
City of Calgary, August 4, 2023 –
Rising rates had little impact on sales this month as the 2,647 sales represented a year-over-year gain of 18 per cent, reflecting the strongest July levels reported on record. The record-setting pace has been driven mainly by significant gains in the relatively affordable apartment condominium sector. Despite recent gains, year-to-date sales have declined by 19 per cent over last year.
In line with seasonal expectations, sales and new listings trended down compared to last month. However, this had minimal impact on inventory levels, which remained near the July record low set in 2006. With a sales-to-new-listings ratio of 82 per cent and a months of supply of 1.3 months, conditions continue to favour the seller.
“Continued migration to the province, along with our relative affordability, has supported the stronger demand for housing despite higher lending rates,” said CREB® Chief Economist Ann-Marie Lurie. “At the same time, we continue to struggle with supply in the resale, new home and rental markets resulting in further upward pressure on home prices.”
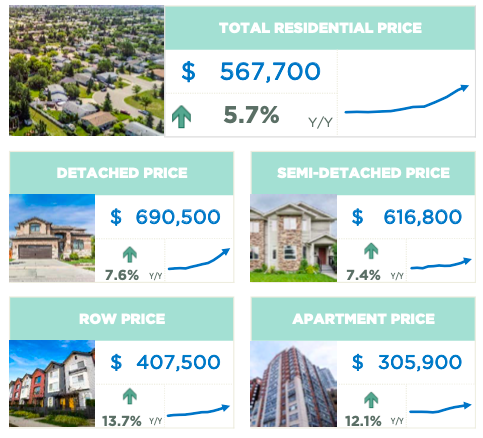
In July, the unadjusted total residential benchmark price reached $567,700, marking the seventh consecutive monthly gain. Prices are now over four per cent higher than the previous peak in May of 2022.
Benchmark home prices reflect a typical home to ensure price movements better reflect market activity. Over time, the typical home evolves and the MLS® Home Price Index also evolves to ensure the data remains in line with modern housing trends. As of today, the benchmark price was recalculated based on a modern typical home. Details on the model adjustments can be found on the Canadian Real Estate Association’s website.
HOUSING MARKET FACTS
Detached
With 1,197 sales and 1,587 new listings in July, inventory levels trended up over last month. However, with 1,720 units available, inventory levels are at the lowest ever reported for July. Inventory levels have declined across all properties priced below $1,000,000.
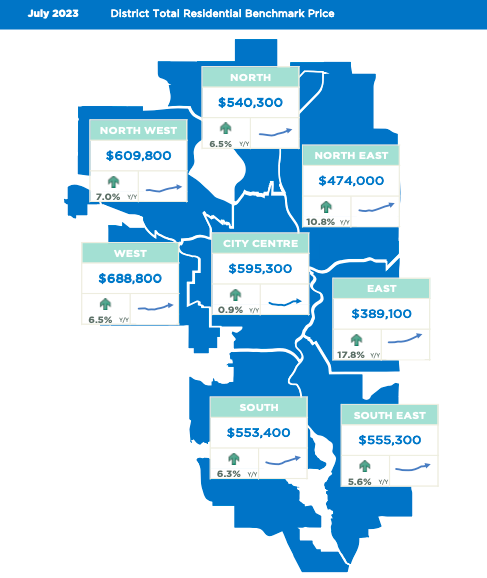
Shifts in sales and inventory have caused the months of supply to trend up over the one month reported over the past several months. However, conditions remain relatively tight, and prices continued to rise this month. In July, the unadjusted benchmark price rose to $690,500, a monthly gain of nearly one per cent and over seven per cent higher than last July. Both year-over-year and monthly price growth was strongest in the city's most affordable North East and East districts.
Semi-Detached
With only 248 new listings in July and 211 sales, the sales-to-new-listings ratio once again pushed above 85 per cent. The pullback in new listings relative to sales ensured that inventory levels remained low, and the months of supply remained just over one month.
With no shift in the sellers’ market conditions, the unadjusted benchmark price continued to trend up in July, reaching $616,800. Monthly gains were strongest in the North East and East district as both rose by over two per cent compared to June. The only district that experienced stability in monthly prices was the City Centre.
Row
July reported 488 new listings and 467 sales, resulting in a sales-to-new listings ratio of 96 per cent. This prevented any additions to the inventory and left the months of supply below one month for the fourth consecutive month.
The persistent sellers’ market conditions caused further price gains for row properties. As of July, the benchmark price reached $407,500, nearly two per cent higher than last month and 14 per cent higher than prices reported last July. Prices trended up across all districts, with the highest monthly gain occurring in the west district at nearly four per cent. The slowest monthly gains happened in the City Centre.
Apartment Condominium
July sales continued to rise over last year's levels, leaving year-to-date sales 16 per cent higher than levels reported last year. This is the only property type that has reported a year-to-date gain in sales activity. This has been possible thanks to recent gains in new listings. However, conditions remain tight for apartment condominiums with a sales-new-listings ratio of 84 per cent and a months of supply of 1.4 months.
The strong demand relative to supply for this property type has driven further price gains this month. As of July, the unadjusted benchmark price reached $305,900, nearly one per cent higher than last month and over 12 per cent higher than last July. While prices are higher than last year in every district, the city center has yet to see the same level of pressure on prices and has reported the lowest year-over-year growth at nearly nine per cent.
(Source: CREB®)