


Calgary Market Report
MARCH 2024
MARCH 2024
If you’re thinking about selling or buying a home, it's important to have a good understanding of what’s going on in the Calgary market.
Knowing the most important data such as the average sales price, number of homes sold, and days on market will better prepare you to sell your home or make an offer.
Our market report showcases everything you need to know about local real estate trends.
New Listings
Inventory
Total Sales
Benchmark Sales Price
Average Days on Market
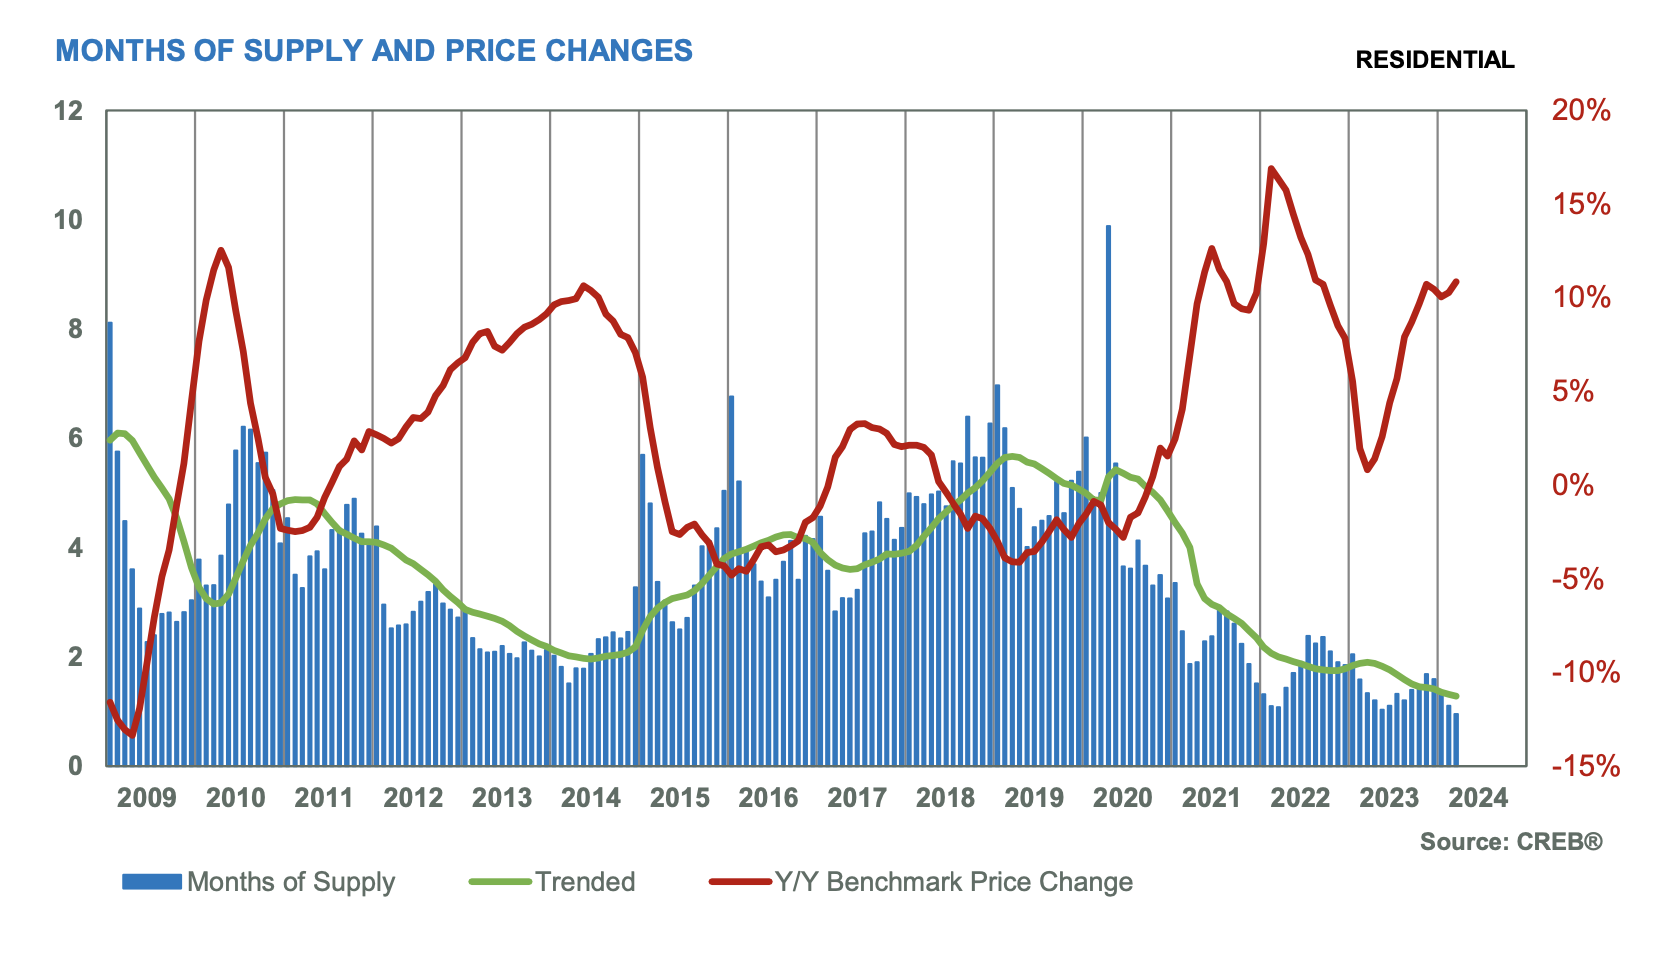
Months of Supply
Sale-to-List Price
City of Calgary, April 1, 2024 –
March sales rose to 2,664 units, a 10 per cent year-over-year gain and much higher than long-term trends. While new listings did pick up over last month, the 3,172 units were still below what we typically see in March and not enough relative to sales to drive any change in the supply situation. In March, the sales-to-new listings ratio rose to 84 per cent, and the months of supply fell below one month.
“We have not seen March conditions this tight since 2006, which is also the last time we reported high levels of interprovincial migration and a months-of-supply below one month," said Ann-Marie Lurie, Chief Economist at CREB®. “Moreover, we are entering the third consecutive year of a market favouring the seller as the two-year spike in migration has driven up demand and contributed to the drop in re-sale and rental supply. Given supply adjustments take time, it is not a surprise that we continue to see upward pressure on home prices.”
Inventory levels have declined across properties priced below $1,000,000, with the steepest declines occurring for homes priced below $500,000. In March, there were 2,532 units in inventory, 22 per cent lower than last year and half the levels we traditionally see in March.
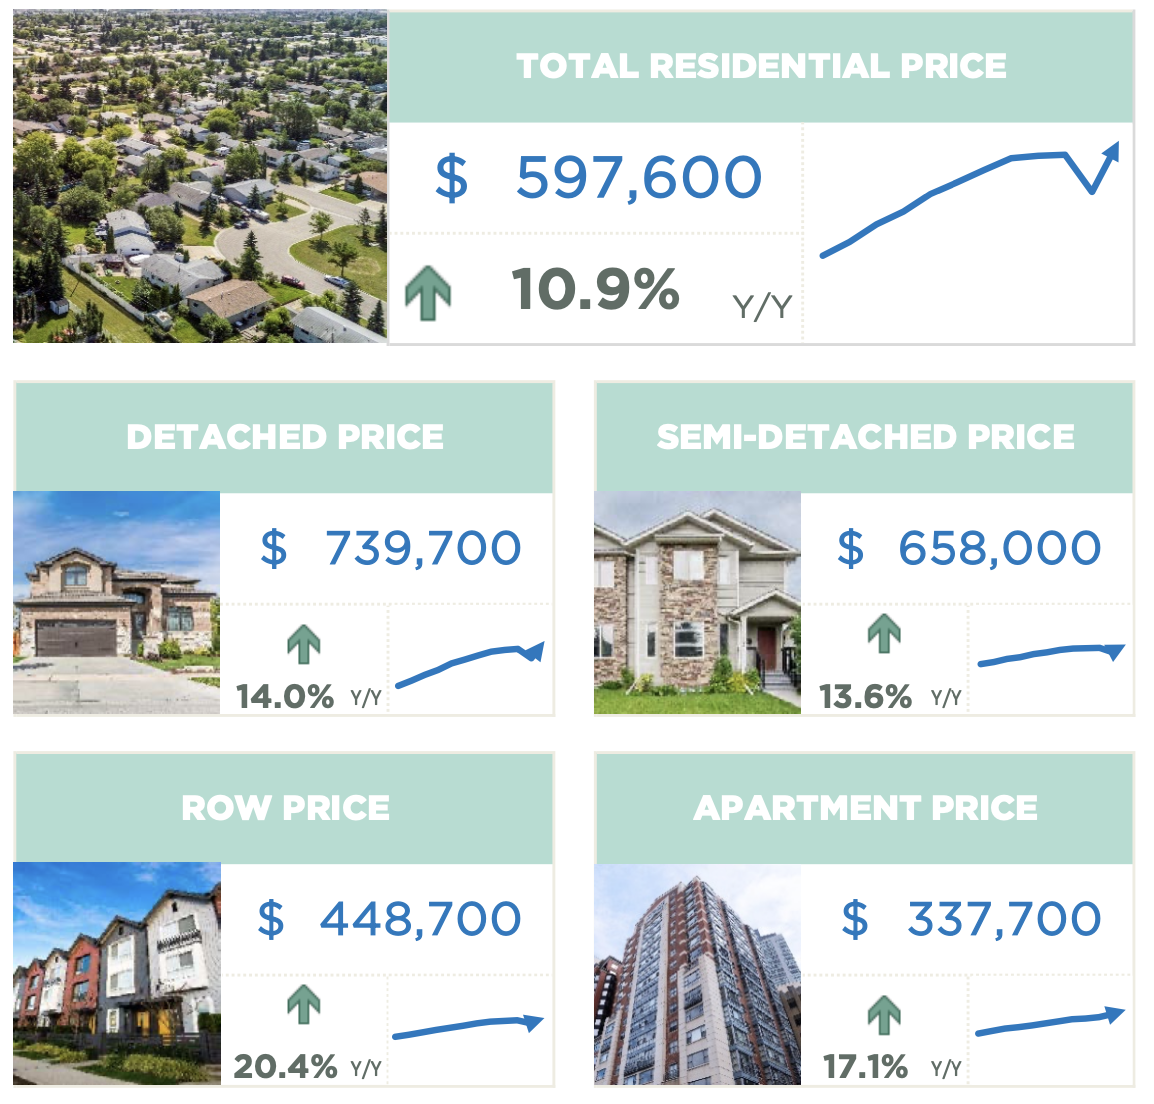
In March, the unadjusted total residential benchmark price rose to $597,600, a two per cent gain over last month and nearly 11 per cent higher than last year. Prices have increased across all property types, with the most significant year-over-year gains occurring for the relatively more affordable row and apartment-style homes.
Benchmark home prices reflect a typical home to ensure price movements better reflect market activity. Over time, the typical home evolves and the MLS® Home Price Index also evolves to ensure the data remains in line with modern housing trends. As of today, the benchmark price was recalculated based on a modern typical home. Details on the model adjustments can be found on the Canadian Real Estate Association’s website.
HOUSING MARKET FACTS
Detached
Detached home sales rose in March but were likely limited by the level of new listings coming onto the market. New listings in March were 1,386 units, compared to the 1,151 sales, causing the sales-to-new listings ratio to rise to 83 per cent. Inventories also remained relatively stable compared to last month but were 24 per cent lower than last year’s levels and nearly 60 per cent lower than long-term trends for March. Inventory levels dropped across all price ranges, but the most significant fall was in the lower price point. Overall, 71 per cent of the available inventory in March was priced above $700,000.
Low inventories compared to sales caused the months of supply to drop below one month, driving further price gains. The unadjusted detached benchmark price rose to $739,700, a monthly gain of nearly three per cent and a year-over-year gain of 14 per cent. The largest year-over-year gains occurred in the most affordable North East and East districts.
Semi-Detached
Supply availability continues to weigh on the semi-detached sector of the market. In March, 260 new listings were met with 250 sales, causing the sale-to-new listings ratio to rise to 96 per cent. This prevented inventories from improving, and the months of supply dropped below one month. Inventory declines have been driven mainly by properties priced below $600,000.
Limited supply and growing demand drove further price gains in March. The unadjusted benchmark price reached $658,000, nearly three per cent higher than last month and a 14 per cent gain over last March. Prices rose across all districts in the city, with year-over-year gains ranging from a low of 11 per cent in the highest-priced area of the City Centre to 25 per cent in the lowest-priced market in the East district.
Row
Both sales and new listings rose in March. However, with 536 new listings and 449 sales, the sales-to-new listings ratio rose to 84 per cent, preventing any significant monthly change in inventory levels. With 355 units available, inventory levels were 12 per cent below last year’s and 53 per cent below long-term trends for March. The decline in inventory levels was driven by properties priced below $400,000, as inventory levels rose 35 per cent for units priced above $400,000.
The unadjusted benchmark price trended up in March, reaching $448,700, a monthly gain of nearly three per cent and over 20 per cent higher than levels reported at this time last year. The higher-priced City Centre reported the slowest growth in benchmark prices, with the highest growth reported in the city's most affordable districts.
Apartment Condominium
Sales in March reached 814 units, contributing to the first quarter’s record-high sales of 1,940 units, nearly 31 per cent higher than last year. New listings also improved throughout the first three months of the year, but with a March sales-to-new-listings ratio of 82 per cent and a months-of-supply of one month, conditions favoured apartment condominium sellers.
Demand for lower-priced homes has supported the growth of apartment-style properties, but the tight conditions have also contributed to further price gains. In March, the benchmark prices reached $337,700, over two per cent higher than last month and 17 per cent higher than levels reported last March.

(Source: CREB®)