


Calgary Market Report
MAY 2023
MAY 2023
If you’re thinking about selling or buying a home, it's important to have a good understanding of what’s going on in the Calgary market.
Knowing the most important data such as the average sales price, number of homes sold, and days on market will better prepare you to sell your home or make an offer.
Our market report showcases everything you need to know about local real estate trends.
New Listings
Inventory
Total Sales
Benchmark Sales Price
Average Days on Market
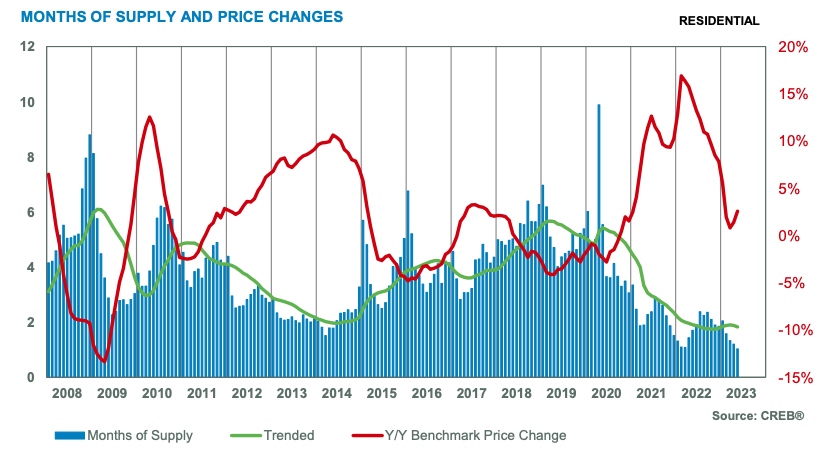
Months of Supply
Sale-to-List Price
City of Calgary, June 1, 2023 –
Thanks to a significant gain in apartment condominium sales, May sales rose to 3,120, a new record high for the month. While the monthly gains have not outweighed earlier declines, this does reflect a shift from the declines reported at the start of the year.
At the same time, we continue to see fewer new listings on the market than last year, causing inventory levels to fall. With a sales-to-new-listings ratio of 85 per cent and months of supply of one month, conditions continue to favour the seller placing further upward pressure on home prices.
“Calgary’s housing market continues to exceed expectations with the recent gain in sales activity this month,” said CREB® Chief Economist Ann-Marie Lurie. “The higher interest rate environment and recent rental rate gains have driven more consumers to seek apartment condominium units. In addition, the recent rise in new apartment listings has provided enough options to support the sales gain. Calgary continues to benefit from the relatively healthy job market and recent population growth keeping housing demand strong across all property types.”
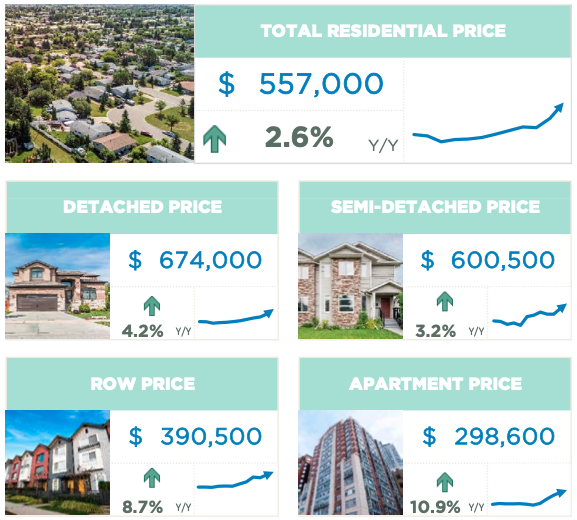
Persistently tight market conditions drove further price growth this month. In May, the unadjusted benchmark price reached $557,000, over one per cent higher than last month and nearly three per cent higher than last year’s monthly peak price of $543,000.
Benchmark home prices reflect a typical home to ensure price movements better reflect market activity. Over time, the typical home evolves and the MLS® Home Price Index also evolves to ensure the data remains in line with modern housing trends. As of today, the benchmark price was recalculated based on a modern typical home. Details on the model adjustments can be found on the Canadian Real Estate Association’s website.
HOUSING MARKET FACTS
Detached
Rising sales for homes priced above $600,000 was not enough to offset declines in the lower price ranges as May sales reached 1,486, a year-over-year decline of eight per cent. New listings continue to fall for homes priced below $700,000, providing limited choice for consumers seeking out lower-priced detached homes. While new listings did improve for higher-priced properties, the relatively strong demand kept conditions tight across all price ranges, driving further price gains.
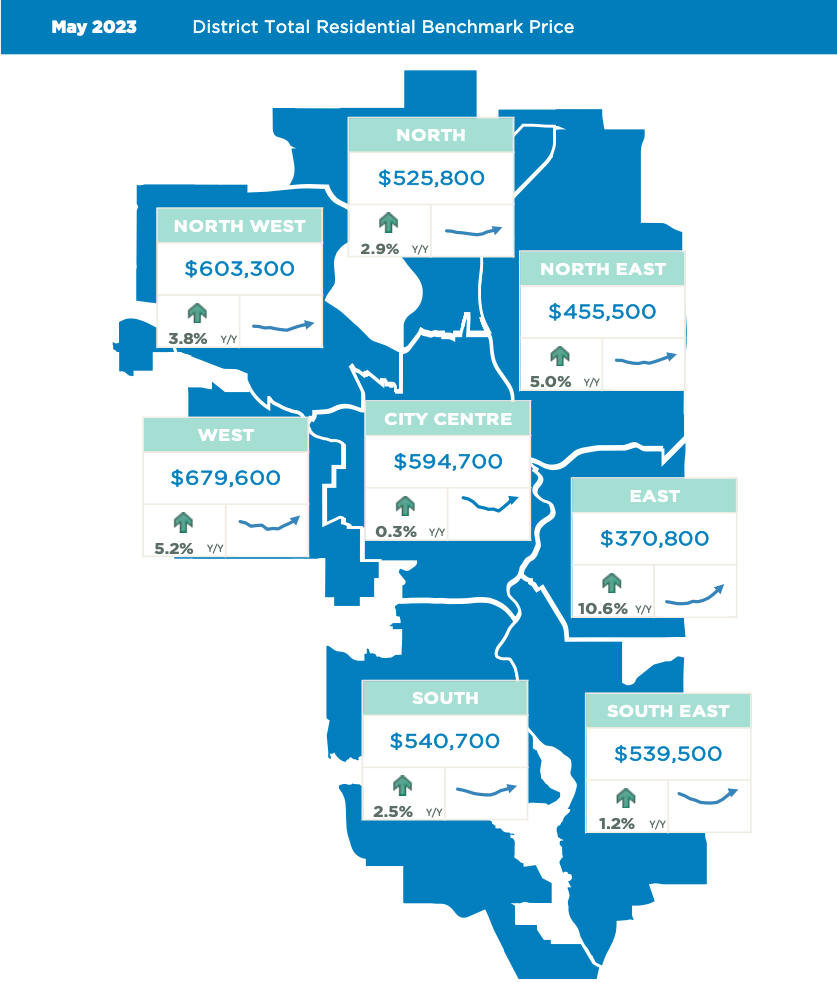
In May, the detached benchmark price reached $674,000, nearly two per cent higher than last month and over four per cent higher than last year’s peak price of $647,000. While each district reported a new record high price this month, the year-over-year gains ranged from a high of 12 per cent in the East District to a low of two per cent in the City Centre.
Semi-Detached
Sales also rose to near-record highs for the month for semi-detached homes. However, with 279 sales and 269 new listings this month, inventories fell, and the months of supply dropped below one month.
The exceptionally tight conditions caused further price gains, which for the first time, pushed above $600,000. This is the seventh consecutive month where prices have trended up, and as of May, levels are over three per cent higher than last year’s monthly peak. Like the detached sector, each district reported new record high prices in May. However, the strongest year-over-year gains occurred in the most affordable East district at nearly 12 per cent.
Row
New listings in May improved over levels seen earlier in the year, but thanks to monthly gains in sales, the sales-to-new listings ratio remained exceptionally high at 89 per cent, preventing any significant shift in the low inventory situation. While sales activity is still lower than last year’s levels, this is likely related to the lack of supply in this segment of the market. Inventory levels are down 50 per cent compared to last year.
With less than one month of supply, it is not a surprise that prices continue to rise. In May, the benchmark price reached $390,500, a two per cent gain over last month and nearly nine per cent higher than last year's peak price of $359,600. Row prices rose across all districts, with year-over-year gains exceeding 15 per cent in the city's North East, South and East districts. The slowest price gains occurred in The City Centre, North West and South East at rates of over seven per cent.
Apartment Condominium
Sales in May reached 858 units, a year-over-year gain of 36 per cent and high enough to cause year-to-date sales to rise by four per cent for a new record high. Stronger sales were possible thanks to the recent gains in new listings. There were 1,025 new listings in May, a year-over-year gain of eight per cent. Despite the gain in new listings, the sales-to-new listings ratio remained high at 84 per cent, preventing any significant shift in inventory levels. As a result, inventory levels remained 23 per cent lower than what was available in the market in May 2022. The rising sales and low inventories kept the months of supply low at just over one month.
Persistently tight conditions drove further price gains in May. The unadjusted benchmark price reached $298,600, a monthly gain of over one per cent and a year-over-year gain of nearly 11 per cent. The recent growth has finally caused unadjusted apartment condominium prices to return to 2014 levels. Unlike other areas, not all districts reported a new record high price. The only areas to report a full recovery were the North, North West, West and South East districts. Overall year-over-year price growth ranged from a high of 16 per cent in the North District to a low of 10 per cent growth in the City Centre.
(Source: CREB®)