Calgary Market Report
NOVEMBER 2021
NOVEMBER 2021
If you’re thinking about selling or buying a home, it's important to have a good understanding of what’s going on in the Calgary market.
Knowing the most important data such as the average sales price, number of homes sold, and days on market will better prepare you to sell your home or make an offer.
Our market report showcases everything you need to know about local real estate trends.
New Listings
Inventory
Total Sales
Average Sales Price
Average Days on Market
Months of Supply
Sale-to-List Price
City of Calgary, Dec. 1, 2021 –
Driven by growth in demand for all property types, there were 2,110 sales in November, just shy of the record for the month set in 2005.
“Lending rates are expected to increase next year, which has created a sense of urgency among purchasers who want to get into the housing market before rates rise,” said CREB® Chief Economist Ann-Marie Lurie.
“At the same time, supply levels have struggled to keep pace, causing tight conditions and additional price gains.”
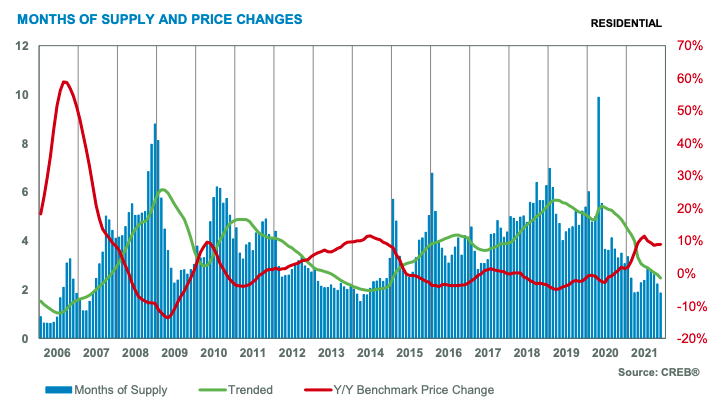
New listings in November totalled 1,989 units, which was fewer than the number of sales this month. With a sales-to-new-listings ratio of over 100 per cent, inventory levels dropped to 3,922 units and the months of supply dipped below two months.
It is not unusual to see new listings and inventories trend down at this time of year, but slower sales are also typical. Instead, sales have remained at roughly the same levels seen since August.
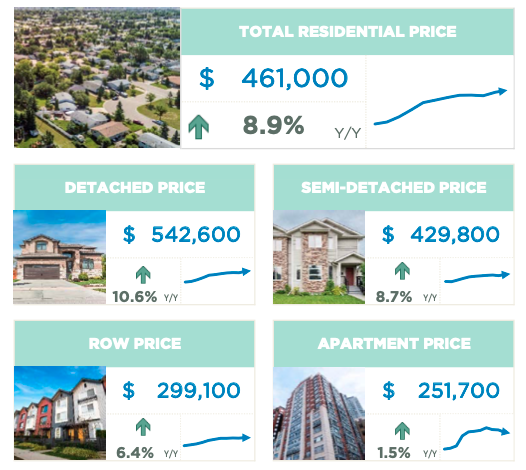
Persistent demand and slow supply reaction caused the benchmark price to trend up this month to $461,000, an increase compared with last month and nearly nine per cent higher than levels recorded last year.
HOUSING MARKET FACTS
Detached
Conditions in the detached home sector continued to tighten in November, with a sales-to-new-listings ratio that pushed up to 118 per cent and the months of supply dropping to 1.2 months. These are levels not seen since the spring.
More than half of sales occurred in the $400,000 – $600,000 price range, but the largest sales gains occurred for properties price above $600,000. This is, in part, related to more supply choice in the upper end of the market compared with the lower end. On a year-to-date basis, homes priced above $600,000 now reflect nearly 31 per cent of all sales, far higher than the 23 per cent recorded last year.
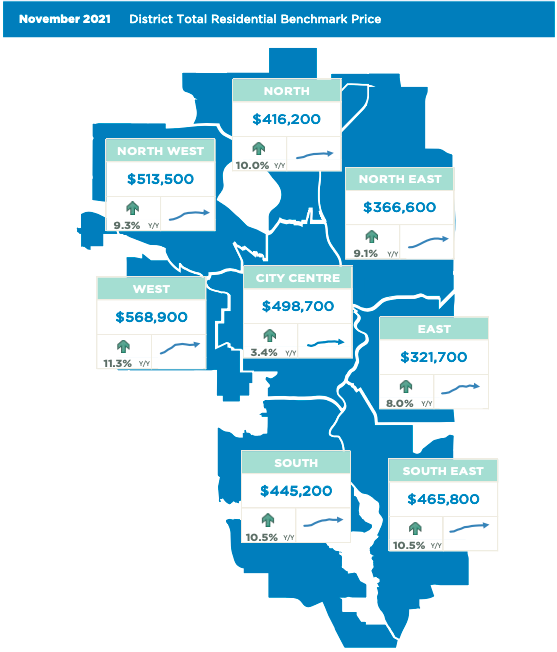
Benchmark prices rose to $542,600, a new monthly record and nearly 11 per cent higher than last year’s levels. Year-over-year price gains have occurred in every district, with the strongest growth occurring in the West, where gains exceeded 13 per cent. The City Centre remains the only district where prices remain below 2014 highs.
Semi-Detached
Another record-high month of sales pushed year-to-date sales to 2,436 units. This is not only a year-to-date record, but also 13 per cent higher than the annual record set in 2014.
With less supply choice in the detached sector, many buyers have shifted their focus to semi-detached homes. However, like the detached sector, semi-detached supply levels have been struggling to keep up, as the months of supply dipped below two months in November.
So far this year, most sales have occurred in the $300,000 – $400,000 range, but activity has increased at the upper end of the market, where semi-detached homes priced above $700,000 now reflect more than 20 per cent of all sales. This is a significant shift compared to last year, where this segment represented only 15 per cent of semi-detached sales.
Thanks to gains in all districts, the semi-detached benchmark price rose to $429,800, which is nearly nine per cent higher than last year. On a year-to-date basis, prices have recovered in all districts except the City Centre, North East and South.
Row
Row properties have not faced the same supply challenges as semi-detached properties so far this year. As a result, the row sector has seen the largest growth in sales, which have already surpassed the annual record high.
Row properties often offer a more affordable alternative to detached homes for consumers who are looking for more space than an apartment condominium. Nearly 83 per cent of all sales that occurred in this sector were priced below $400,000.
While row supply levels have not been as tight as in the detached or semi-detached sectors, strong demand has caused inventories to fall. This is contributing to tighter market conditions in this segment as well.
With less supply/demand pressures for this property type, prices have not experienced the same gains seen among detached or semi-detached homes. On a year-to-date basis, the benchmark price was six per cent higher than last year, but it remains lower than previous highs set in 2015.
Apartment Condominium
The apartment condominium sector recorded another month of strong growth, contributing to year-to-date sales of 3,834. Sales remain far from record highs, but this is still the highest level of activity seen since 2014.
Improving sales led to slightly tighter conditions in this market, but inventory levels were high relative to historical levels, making this segment an outlier compared with the other property types.
Supply challenges have not been as prevalent for apartment condominiums, so prices growth and recovery in the sector have remained far lower than the other property types. However, on a year-to-date basis, prices have improved by more than two per cent in a reversal of the steady annual decline recorded since 2015.


(Source: CREB®)